Dubai’s property market closed Q1 2026 with Dh176.7 billion across 47,996 transactions — a 23.4% surge in value while the region sat in active conflict. We break down the DLD data by asset class, off-plan dominance, supply reality, and where the smart capital is deploying.
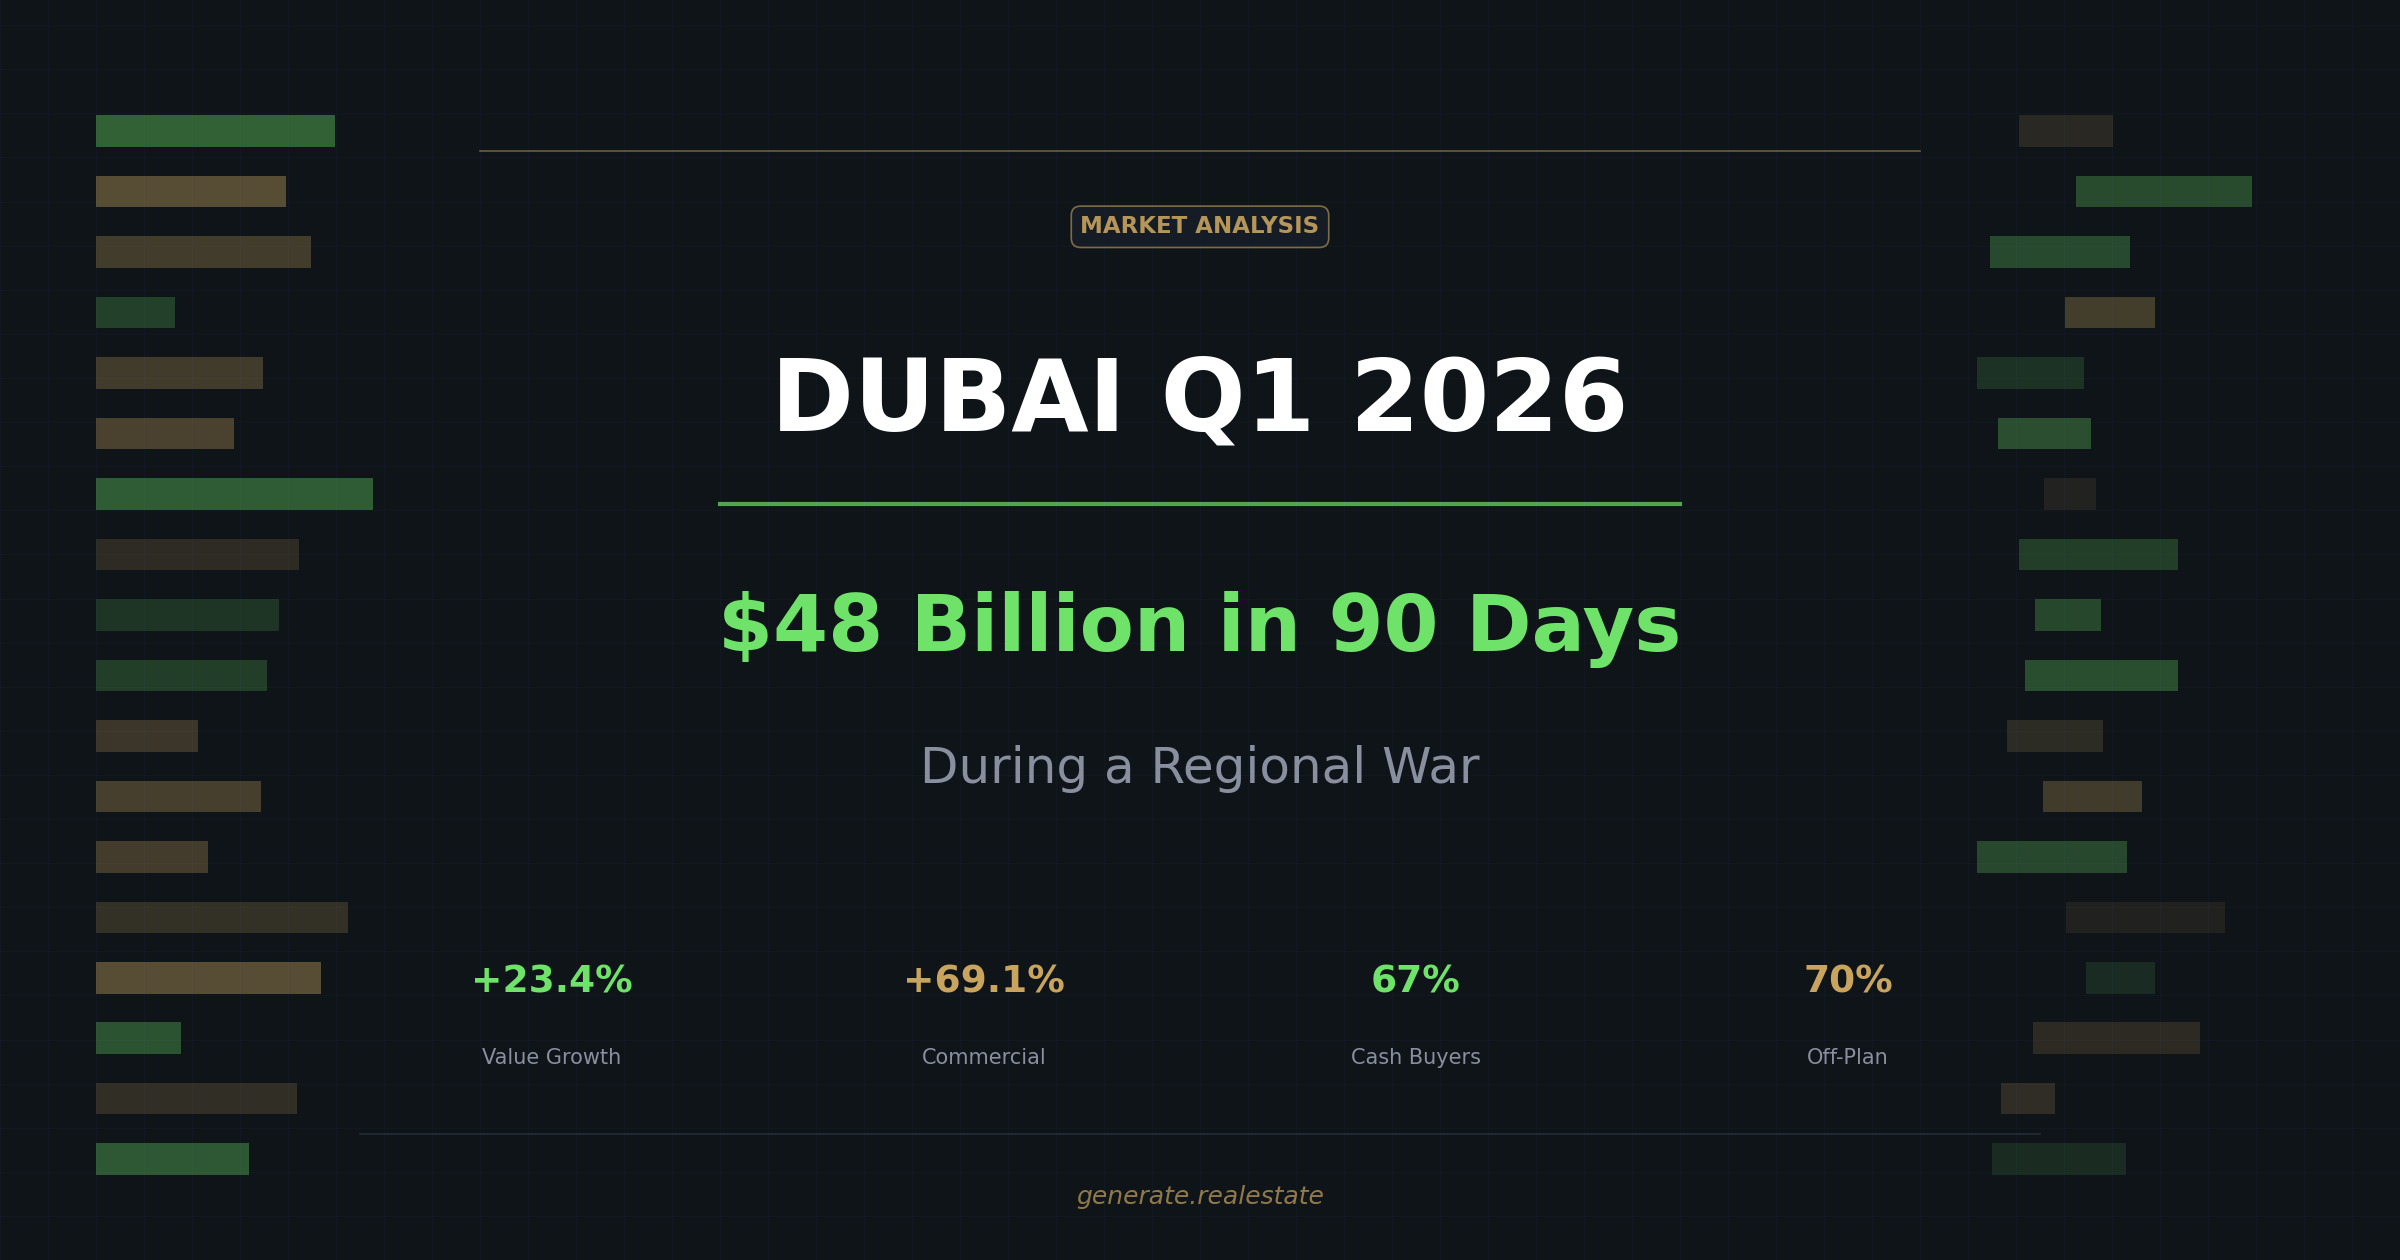
Forty-eight billion dollars.
That is what Dubai’s property market recorded in Q1 2026.
Not during a period of calm. During an active regional conflict between Iran and the United States — while half the world’s financial press was writing obituaries for Gulf real estate.
The obituaries were premature. The DLD data tells a completely different story.
Here is the full breakdown — segment by segment, asset class by asset class.
The Headline Numbers
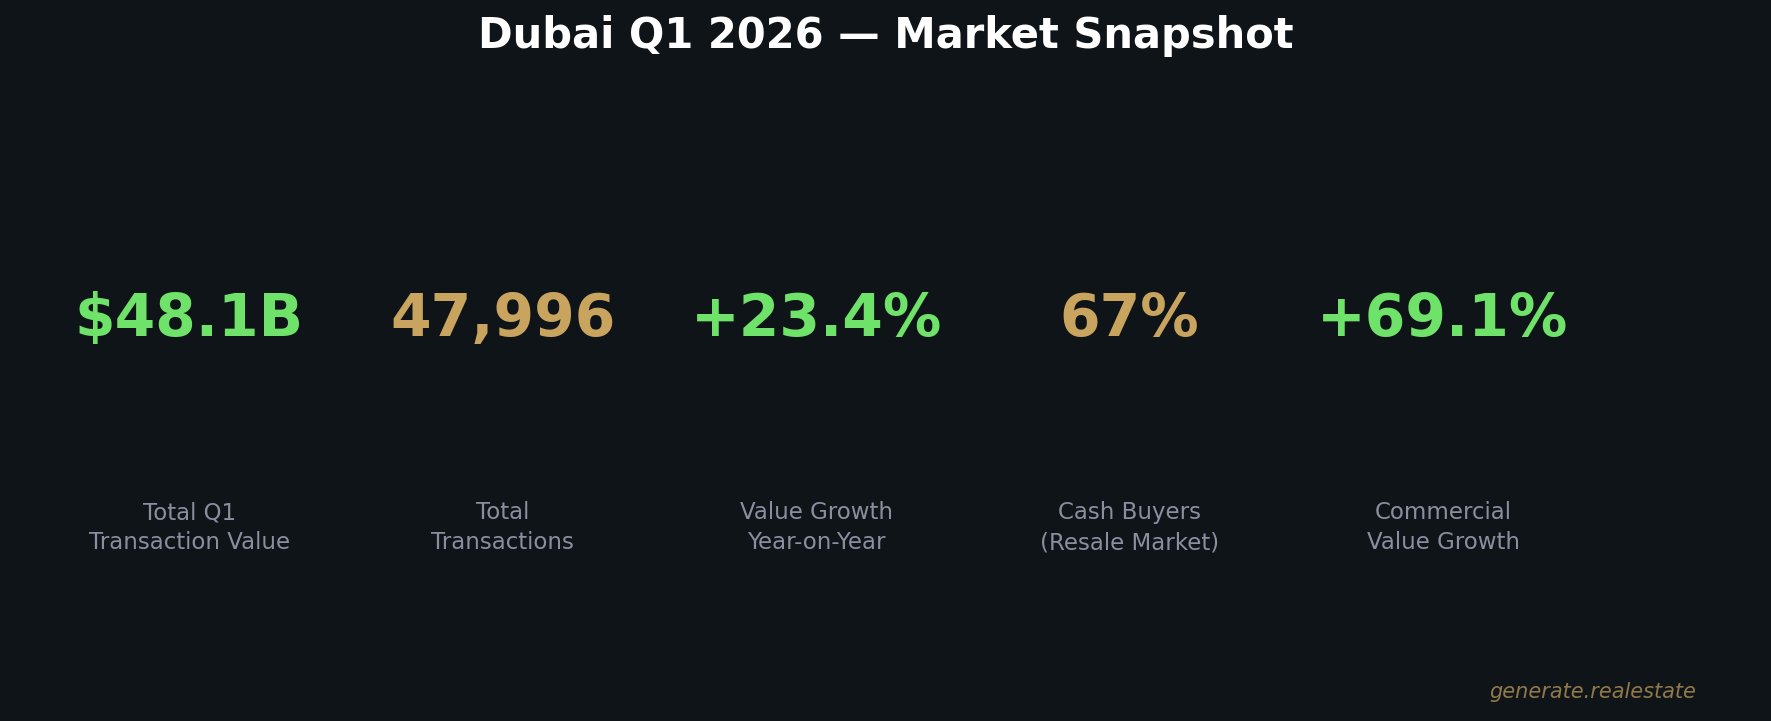
The Dubai Land Department recorded 47,996 transactions in Q1 2026.
Total value: Dh176.7 billion ($48.11 billion).
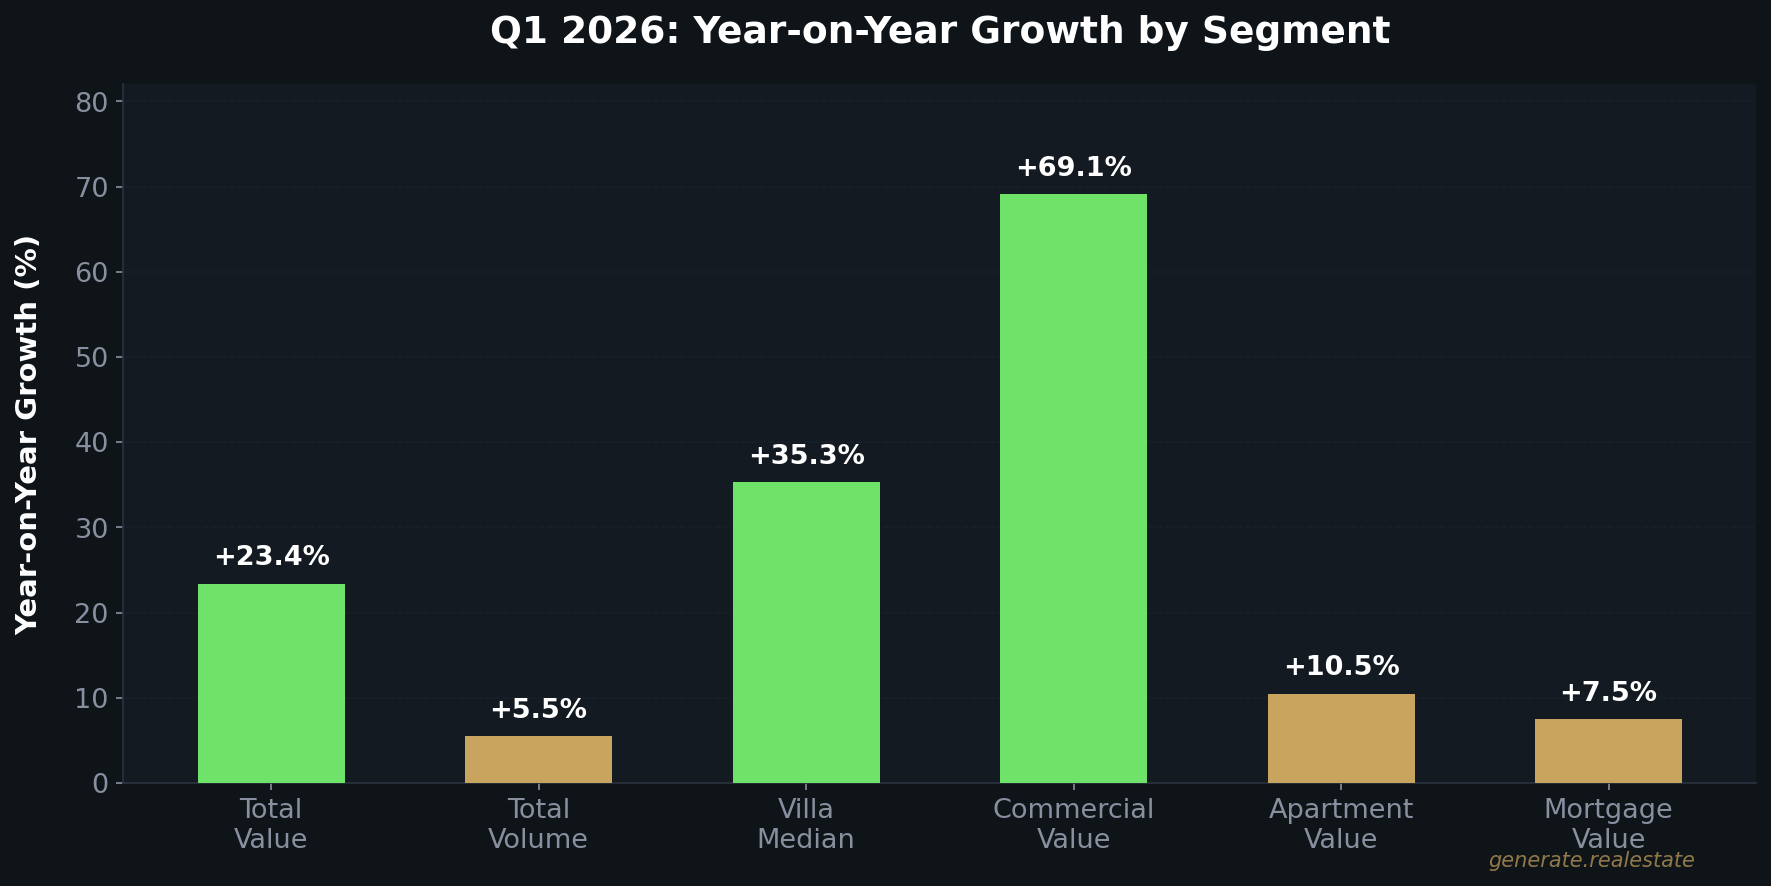
Year-on-year value growth: +23.4%.
Year-on-year volume growth: +5.5%.
That spread is the most important signal in the entire dataset.
When value grows four times faster than volume, it means one thing: average deal sizes are expanding.
The buyers entering this market are not retail investors flipping studios off Instagram ads. They are institutional allocators, family offices, and high-net-worth individuals deploying at higher price points.
Harbor Real Estate’s independent Q1 report confirms it:
+28.5% growth in overall market value.
January alone hit Dh72.4 billion — a 63% year-on-year increase.
Off-plan values in January surged 128%.
This is a maturation signal, not a bubble signal.
The market is not getting hotter. It is getting heavier.
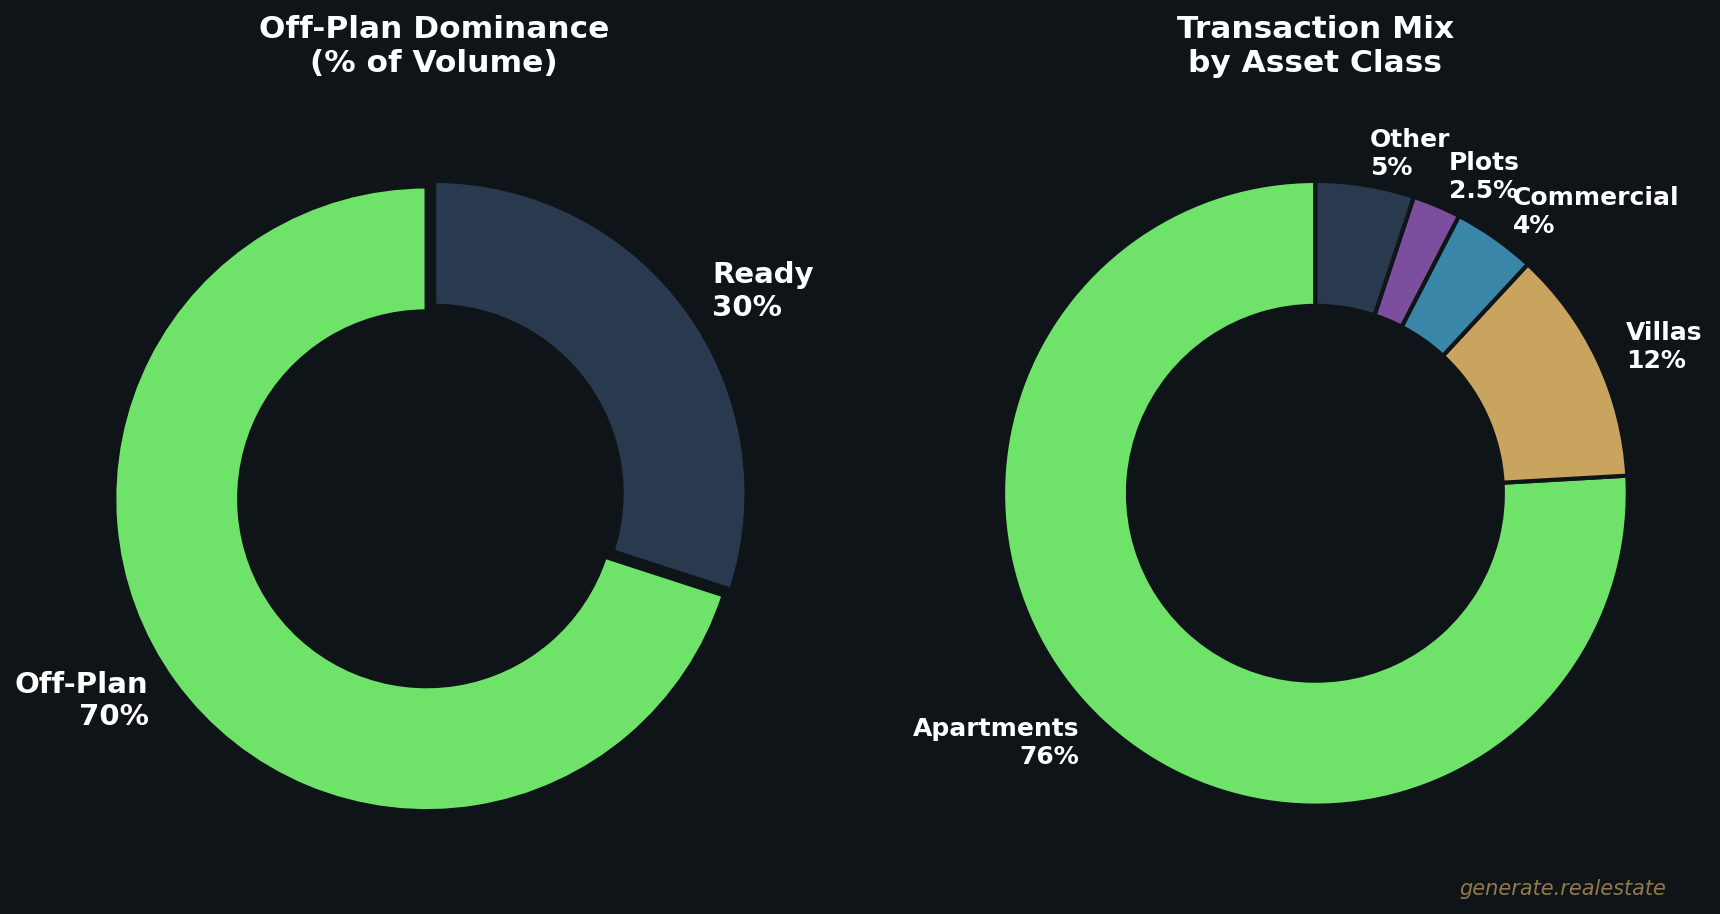
Off-Plan Dominance: 70% of the Market
70% of all Q1 transactions were off-plan.
71% of total value was off-plan.
For apartments: 75.64%.
March alone: 10,303 off-plan transactions totalling Dh31.2 billion.
That is +5.4% in volume and +8.9% in value versus the same month last year.
The Supply Question
Every institutional investor asks the same thing: “Is there too much supply?”
The answer requires nuance.
Knight Frank tracks 160,000+ registered units in the pipeline.
Cushman & Wakefield expects actual deliveries closer to 55,000.
That is a gap of over 100,000 units between registration and reality.
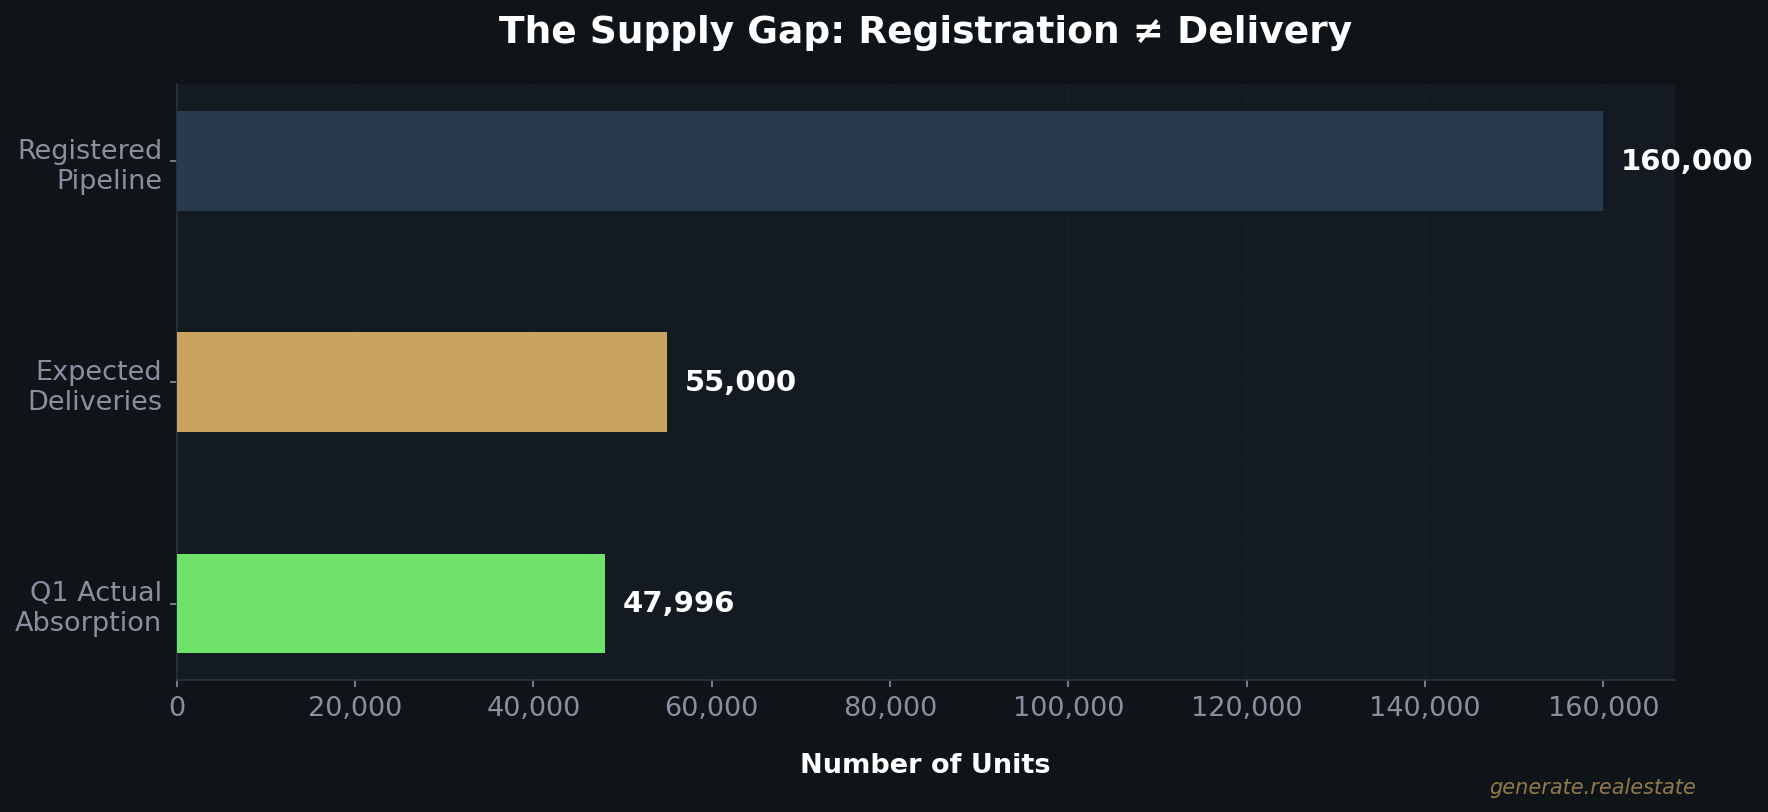
Why the gap? Registration is not delivery.
Construction delays. Phased launches. Market-responsive scheduling. The real supply hitting the market is roughly a third of the registered number.
Off-plan is not dominant because buyers are desperate.
It is dominant because ready inventory in desirable communities is genuinely scarce.
Buyers who want a two-bedroom in Dubai Hills or a waterfront apartment in Creek Harbour cannot find what they want in the secondary market. So they commit forward.
That is a demand signal, not a supply problem.
Asset Class Breakdown
The aggregate numbers tell one story. The asset class data tells a much more actionable one.
Villas — Supply-Constrained Appreciation
8,261 transactions. Dh59.1 billion in total value.
Volume up +17.9% year-on-year.
Median villa price: Dh4.1 million — up 35.3% YoY.
Resale villa median: Dh4.3 million — up 16.2%.
You cannot build villas fast enough to meet demand in established communities.
Land in Dubai Hills, Arabian Ranches, and prime waterfront zones is finite. When it is gone, it is gone. New villa supply is being pushed to peripheral locations that do not carry the same premium.
For investors with a 2–5 year horizon, prime villas are the most structurally protected asset class in the UAE.
Commercial — The Strongest Conviction Signal
2,048 transactions. Dh10.2 billion in total value.
Value growth: +69.1% year-on-year.
Read that again. Sixty-nine percent growth in commercial real estate value during a regional conflict.
This is not panic buying. This is not speculation.
This is institutional capital anchoring permanent operations in the UAE.
The DIFC expansion. The Abu Dhabi Financial District buildout. Hedge funds and family offices migrating from London and Geneva. Regional HQs shifting from Riyadh and Doha into Dubai.
Institutions do not buy office floors because they think a conflict will blow over. They do it because they have made a permanent strategic decision.
Apartments — The Yield Engine
36,428 transactions. Dh75.2 billion in value. Up +10.5% YoY.
One-bedrooms: 42% of all apartment activity.
Studios: 24.7%.
Together, compact formats = 67% of the apartment market.
This is where the yield sits:
Dubai Marina, JVC, Business Bay, Downtown — consistently 6% to 8% net annual rental returns.
For context:
London: ~2.5% net.
Manhattan: ~3%.
Sydney: ~3.5%.
Dubai’s yield premium is not marginal. It is double or triple the world’s most established markets — with zero income tax on top.
The Great Decoupling
Gulf Business coined the term in early April: “The Great Decoupling.”
Dubai’s property market is no longer behaving like an emerging-market sector that trembles at every geopolitical headline.
It is structurally decoupling from the volatility that has historically rattled comparable markets.
This is not the first time.
Dubai has a documented pattern stretching back two decades:
The Iraq War (2003) → capital flowed into Dubai.
Post-2008 recovery → capital flowed into Dubai.
The Arab Spring → capital flowed into Dubai.
COVID-19 (2020–21) → capital flowed into Dubai.
Iran–US conflict (2026) → capital is flowing into Dubai.
The market is not slowing down. It is repricing upward because the capital flowing in is larger, more sophisticated, and more permanent than anything Dubai has ever absorbed before.
Three Structural Forces Behind This Cycle
1. Golden Visa & long-term residency.
The ten-year visa, retirement visa, freelancer visa, and investor visa have removed the single biggest friction point that kept institutional capital on the sidelines. Foreign investors can now own, reside, and operate permanently.
2. Regulatory maturity under RERA & DLD.
Escrow protections. Developer registration. Standardised contracts. A functioning dispute resolution mechanism. Dubai has gone from “wild west” narrative to a regulated, auditable market that rivals developed-world standards.
3. Zero income tax.
While the UK raises capital gains tax, France tightens wealth taxes, and the US debates carried interest — the UAE’s zero-tax framework is pulling wealth migration at scale.
Henley & Partners tracked 9,800 millionaires migrating to the UAE in 2025 alone.
Cash buyers still account for 67% of the resale market.
Mortgage activity reached Dh59.8 billion (+7.5% YoY) — but the dominance of cash tells you everything about capital quality.
This is equity deployment, not leveraged speculation.
Where the Smart Money Should Be Looking
Data without allocation guidance is just noise. Here is where the numbers point.
Ultra-prime:
Dh422 million sale at Aman Residences Tower 2. Dh350 million villa at Jumeirah First.
These are not investment trades. These are permanent residency anchors — a leading indicator of commitment depth.
Prime communities (constrained supply):
Dubai Hills. Arabian Ranches. Waterfront villa launches. Select towers in DIFC and Downtown.
Limited future supply + highest wealth migration demand = asymmetric return potential over the next 24–36 months.
Volume corridors (watch carefully):
JVC, Dubai South, and Al Yelayiss 1 lead transaction activity.
But 45% of all under-construction supply is concentrated in just five districts: JVC, JVT, Dubai South, MBR City, and Business Bay.
Those areas face the most supply pressure over the next 2–3 years.
If you are buying for yield there, your underwriting needs to account for potential rental compression.
Fitch has flagged moderate correction risk in mid-market segments. I agree with them there — that is where supply and demand are closest to equilibrium.
But at the prime end?
Constrained supply + accelerating wealth migration + zero tax = continued repricing upward.
The Bottom Line
$48 billion in property sales in 90 days. During a war.
Values: +23.4%.
Volume: +5.5%.
Commercial: +69.1%.
Villas: +35.3% median.
Cash buyers: 67% of resale.
Off-plan absorption: 70% of all activity.
The data does not care about the headlines.
The question is not whether Dubai’s market is real. Q1 settles that.
The question is whether you are in the right segment before the repricing accelerates further.
If you want the full data set behind this analysis, or want to discuss where to deploy — reach out. I am happy to walk you through it.
Data sources: Dubai Land Department Q1 2026, Harbor Real Estate Q1 2026 Report, fäm Properties, Knight Frank, Cushman & Wakefield, Fitch Ratings, Henley & Partners, AIQYA Q1 Analysis, Gulf Business.